Home is where the heart is—but not always where the wins are
The other day, I read in Sports Illustrated (smoke ‘em if ya got ‘em) that road teams in Major League Baseball are having an easier go of it than almost ever before. In 2023, home team winning percentage was down to .521—the lowest number since 1971.
Whereas NFL stadium noise is a tangible factor in team performance, no such direct fan outcome is seen on the diamond. With stadium dimensions becoming more standardized, playing surfaces impeccably manicured, and visiting quarters more posh than podunk, it stands to reason that the guys batting first aren’t at such a disadvantage any longer.
With that in mind, I was curious about the best (and worst) home/road winning percentages in Minnesota Twins history…
Best Home Winning Percentage
(Note: Technically, the pandemic-shortened 2020 season produced a franchise-best .774 home WP. Perhaps unused seats should feature cardboard cutouts again?)
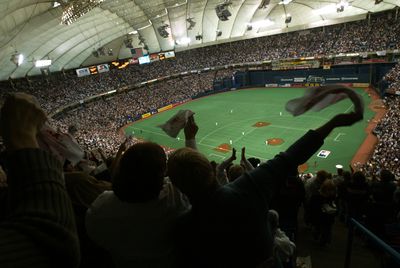
- 1969: .704 (57-24)
- 1987: .691 (56-25)
- 2002 & 2006: .667 (54-27)

Worst Home Winning Percentage
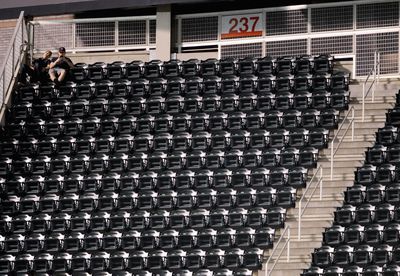
- 2016: .370 (30-51)
- 2012: .383 (31-50)
- 2013: .395 (32-49)

Photo by Hannah Foslien/Getty Images
Best Road Winning Percentage
- 2019: .679 (55-26)
- 1965: .630 (51-30)—remarkably, this World Series squad also went exactly 51-30 at home
- 1962: .568 (46-35)

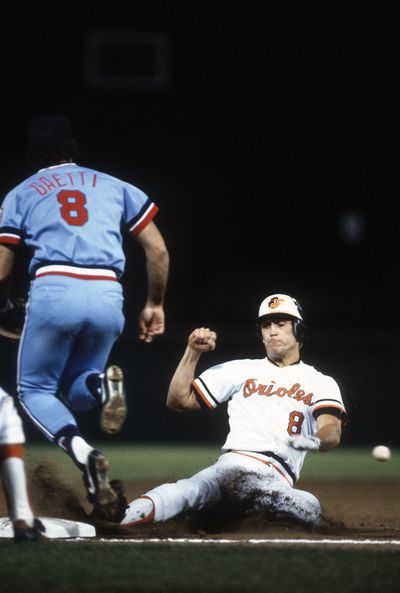
Photo by Nuccio DiNuzzo/Getty Images
Worst Road Winning Percentage
- 1982: .284 (23-58)
- 1986: .346 (28-53)
- 1981: .347 (17-32)—a strike-shortened (perhaps mercifully so) season

All of this would seem to bode well for Baldelli’s Bunch, as Rocco holds the single-season high water mark for road success. In a league where last-ups means less than it has for 50+ years, this may be more “crucial facet” than “fun oddity” heading into 2024.